
每秒上百万级ELK日志平台优化
没错我是一个标题党!
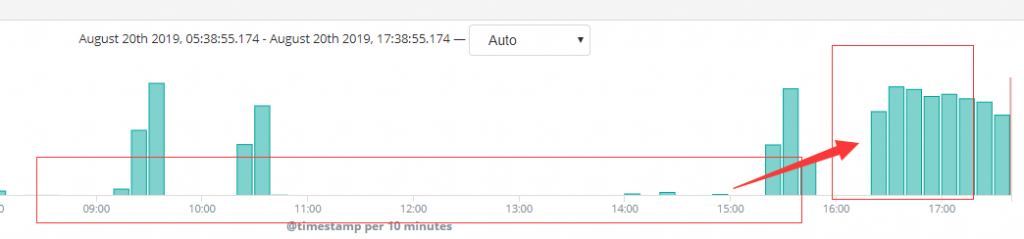
kibana显示日志延迟,kafka消息堆积,elasticsearch动不动就OOM: 优化前VS优化后
Marking url as dead. Last error: [LogStash::Outputs::ElasticSearch::HttpClient::Pool::HostUnreachableError
org.elasticsearch.cluster.metadata.ProcessClusterEventTimeoutException: failed to process cluster event (put-mapping) within 30s
1、开启多个logstash消费kfka,也就是logstash高可用
input{
  kafka{
    bootstrap_servers => "xx.xxx.xx.xx:9091,xxx.xx.140:9092,xxx.xx.x.140:9093"
    topics => "ali-k8s-logs"
    consumer_threads => 10   #多个logstash等于topicd的PartitionCount:20
    client_id => "logstash-A"  #使用不同的client_id
    group_id => "logstash"
    decorate_events => true
    codec => json
    auto_offset_reset => "latest"
}

}
2、Elasticsearch优化,根据自己服务器配置来
thread_pool:
    bulk:
        size: 3
        queue_size: 5000
indices.fielddata.cache.size:  10%
3、logstash output
output {

  elasticsearch {
    hosts => [""]
    index => "logstash-k8s-%{pod_name}-%{+YYYY.MM.dd}"
    pool_max => "5000"
    pool_max_per_route => "500"
  }
logstash配置优化
# pipeline线程数,官方建议是等于CPU内核数
pipeline.workers: 24
# 实际output时的线程数
pipeline.output.workers: 24
# 每次发送的事件数
pipeline.batch.size: 10000
# 发送延时
pipeline.batch.delay: 10
4、Elasticsearch 优化JVM还老是OOM的,GC改G1GC
## GC configuration
#-XX:+UseConcMarkSweepGC
##-XX:CMSInitiatingOccupancyFraction=75
#-XX:+UseCMSInitiatingOccupancyOnly
-XX:+UseG1GC
-XX:MaxGCPauseMillis=50
还有就是分片啦,现象一下一个16G服务器跑1个数据库实例和
一个16G服务器跑上千个数据库实例
修改 refresh_interval设置为1s,势必会产生大量的segment,检索性能会受到影响 cpu高
PUT  /_settings
{
  "refresh_interval" : "60s"
}
来查询一下ES当前的线程情况:
GET _nodes/stats/thread_pool?prettyES集群优雅停止,启动
ES默认是开启自动分片均衡的. 那么如果想要我们在停止,启动某个ES实例后, 可以快速将集群状态变更为Green. 我们最好可以采用如下步骤进行:
关闭自动分片
curl -XPUT http://127.0.0.1:9200/_cluster/settings -d '{"transient":{"cluster.routing.allocation.enable":"none"}}'

建议重启前手动执行curl -XPOST '127.0.0.1:9200/_flush/synced'
优雅停止你要升级或检测的ES实例
重新启动集群的分片自动均衡
curl -XPUT http://127.0.0.1:9200/_cluster/settings -d' {  "transient" : {  "cluster.routing.allocation.enable" : "all"  } }'
_cluster/settings?pretty
ES配置文件详解
cluster.name: elasticsearch
#配置es的集群名称,默认是elasticsearch,es会自动发现在同一网段下的es,如果在同一网段下有多个集群,就可以用这个属性来区分不同的集群。
node.name: "Franz Kafka"
#节点名,默认随机指定一个name列表中名字,该列表在es的jar包中config文件夹里name.txt文件中,其中有很多作者添加的有趣名字。
node.master: true
#指定该节点是否有资格被选举成为node,默认是true,es是默认集群中的第一台机器为master,如果这台机挂了就会重新选举master。
node.data: true
#指定该节点是否存储索引数据,默认为true。
index.number_of_shards: 5
#设置默认索引分片个数,默认为5片。
index.number_of_replicas: 1
#设置默认索引副本个数,默认为1个副本。
path.conf: /path/to/conf
#设置配置文件的存储路径,默认是es根目录下的config文件夹。
path.data: /path/to/data
#设置索引数据的存储路径,默认是es根目录下的data文件夹,可以设置多个存储路径,用逗号隔开,例:
#path.data: /path/to/data1,/path/to/data2
path.work: /path/to/work
#设置临时文件的存储路径,默认是es根目录下的work文件夹。
path.logs: /path/to/logs
#设置日志文件的存储路径,默认是es根目录下的logs文件夹
path.plugins: /path/to/plugins
#设置插件的存放路径,默认是es根目录下的plugins文件夹
bootstrap.mlockall: true
#设置为true来锁住内存。因为当jvm开始swapping时es的效率会降低,所以要保证它不swap,可以把#ES_MIN_MEM和ES_MAX_MEM两个环境变量设置成同一个值,并且保证机器有足够的内存分配给es。同时也要#允许elasticsearch的进程可以锁住内存,linux下可以通过`ulimit -l unlimited`命令。
network.bind_host: 192.168.0.1
#设置绑定的ip地址,可以是ipv4或ipv6的,默认为0.0.0.0。
network.publish_host: 192.168.0.1
#设置其它节点和该节点交互的ip地址,如果不设置它会自动判断,值必须是个真实的ip地址。
network.host: 192.168.0.1
#这个参数是用来同时设置bind_host和publish_host上面两个参数。
transport.tcp.port: 9300
#设置节点间交互的tcp端口,默认是9300。
transport.tcp.compress: true
#设置是否压缩tcp传输时的数据,默认为false,不压缩。
http.port: 9200
#设置对外服务的http端口,默认为9200。
http.max_content_length: 100mb
#设置内容的最大容量,默认100mb
http.enabled: false
#是否使用http协议对外提供服务,默认为true,开启。
gateway.type: local
#gateway的类型,默认为local即为本地文件系统,可以设置为本地文件系统,分布式文件系统,hadoop的#HDFS,和amazon的s3服务器,其它文件系统的设置方法下次再详细说。
gateway.recover_after_nodes: 1
#设置集群中N个节点启动时进行数据恢复,默认为1。
gateway.recover_after_time: 5m
#设置初始化数据恢复进程的超时时间,默认是5分钟。
gateway.expected_nodes: 2
#设置这个集群中节点的数量,默认为2,一旦这N个节点启动,就会立即进行数据恢复。
cluster.routing.allocation.node_initial_primaries_recoveries: 4
#初始化数据恢复时,并发恢复线程的个数,默认为4。
cluster.routing.allocation.node_concurrent_recoveries: 2
#添加删除节点或负载均衡时并发恢复线程的个数,默认为4。
indices.recovery.max_size_per_sec: 0
#设置数据恢复时限制的带宽,如入100mb,默认为0,即无限制。
indices.recovery.concurrent_streams: 5
#设置这个参数来限制从其它分片恢复数据时最大同时打开并发流的个数,默认为5。
discovery.zen.minimum_master_nodes: 1
#设置这个参数来保证集群中的节点可以知道其它N个有master资格的节点。默认为1,对于大的集群来说,可以设置大一点的值(2-4)# 通过配置大多数节点(节点总数/ 2 + 1)来防止脑裂
discovery.zen.ping.timeout: 3s
#设置集群中自动发现其它节点时ping连接超时时间,默认为3秒,对于比较差的网络环境可以高点的值来防止自动发现时出错。
discovery.zen.ping.multicast.enabled: false
#设置是否打开多播发现节点,默认是true。
discovery.zen.ping.unicast.hosts: ["host1", "host2:port", "host3[portX-portY]"]
#设置集群中master节点的初始列表,可以通过这些节点来自动发现新加入集群的节点。
Thread pool参数.
GET /_cat/thread_pool/write?v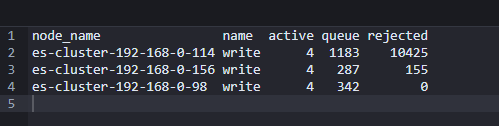
thread_pool:
    write:
        size: 4    // 默认是available processors
        queue_size: 5000
threadpool:
#这是批量插入时需要做的配置
bulk:
type: fixed
# 设置的和cpu数量一致
size: 24
queue_size: 10000
#检索时需要做的配置
search:
tyep: fixed
# 设置的和cpu数量一致
size: 24
queue_size: 10000修改用户elastic 和 kibana的密码
X-Pack security provides a built-in elastic superuser you can use to start setting things up. The default password for the elastic user is changeme.
curl -XPUT -u elastic 'localhost:9200/_xpack/security/user/elastic/_password' -d '{
  "password" : "elasticpassword"
}'
curl -XPUT -u elastic 'localhost:9200/_xpack/security/user/kibana/_password' -d '{
"password" : "kibanapassword"
}'查看 GET _template/logstash
安装x-pack
https://www.elastic.co/guide/en/logstash/6.2/installing-xpack-log.html

