
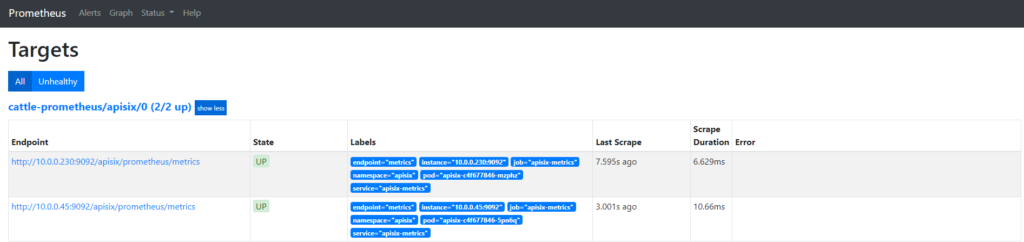
Apisix接入prometheus插件监控
修改配置文件
    plugin_attr:
          skywalking:
            service_name: APISIX_INGRESS
            service_instance_name: "APISIX Instance Name"
            endpoint_addr: http://skywalking.kube-ops.svc.cluster.local:12800
          prometheus:
            export_addr:
                 ip:  ${{HOSTNAME}}
                 port: 9092
接入prometheus
apiVersion: monitoring.coreos.com/v1
kind: ServiceMonitor
metadata:
  name: apisix
spec:
  endpoints:
   - scheme: http
     # [note] use the container port name exposed by the workload in the previous step
     port: metrics
     path: /apisix/prometheus/metrics
     interval: 15s
  namespaceSelector:
    matchNames:
      - apisix
  selector:
    matchLabels:
      app: apisix
apiVersion: v1
kind: Service
metadata:
  labels:
    app: apisix
  name: apisix-metrics
  namespace: apisix
spec:
  ports:
  - name: metrics
    port: 9092
    protocol: TCP
    targetPort: 9092
  selector:
    app.kubernetes.io/instance: apisix
    app.kubernetes.io/name: apisix
  se犀利士
ssionAffinity: None
  type: ClusterIP
kubectl apply -f apisix_servicemonitor.yaml -n prometheushttps://apisix.apache.org/zh/docs/apisix/2.15/plugins/prometheus/


晨汐网
2022年12月30日 下午5:37
博主你好,你的网站做得真好,可以跟你换个友链吗?